
*New Feature Alert*: Updated Reporting
Our new, more powerful reporting to help you grow smarter
Tracking referrals is important. Understanding which referral sources are driving real patient starts is even more valuable.
That's why we've introduced a major upgrade to Bright Referral's reporting experience. With more detailed analytics, interactive charts, and expanded referral source insights, it's easier than ever to measure referral source health and make informed decisions about your relationship-building efforts.
Check out the details here:
Measure the Health of Every Referral Source
Your dashboard now provides a more complete picture of the patient journey—all in one place.

Instead of simply counting referrals, you can now see how patients progress through each stage of your referral funnel, including:
Referrals Received
Contact Information Shared
Appointments Scheduled
Treatment Starts
This gives you a much clearer understanding of not only who's referring patients, but also which referral sources are generating engaged patients who ultimately begin treatment.
Interactive Reporting That Goes Deeper
We've also made reporting significantly more interactive.
When viewing reports by year, month, or day, simply hover over any bar in a graph to see a detailed breakdown of the data behind it.
Rather than seeing only a total number of referrals, you'll be able to identify:
Which referral sources contributed to that total
Where patients who shared contact information originated
Which referral sources produced scheduled appointments
Which relationships are leading to treatment starts
These interactive insights make it easier to identify trends, celebrate high-performing referral partners, and uncover opportunities for growth.
Analyze Your Data Your Way
Every practice looks at referral performance differently, so Bright Referral continues to provide multiple ways to explore your data.
You can still organize reports by:
Referral Source
Referral Category
Tags
Date Range
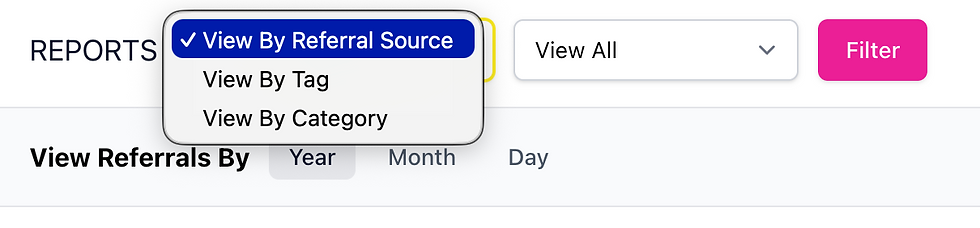
Need to see how your medical referrals are performing? Want to compare schools, dentists, or community partners? Simply apply a filter and your reports update instantly, giving you meaningful insights in just a few clicks.
More Insight on Every Referral Source
We've also enhanced the Referral Sources page to provide a more informative snapshot before you even open a referral source.
Each referral source card now displays:
Referral Source Category
Historical referral estimate (if provided during setup)
Total Referrals
Total Contact Information Shared
Total Appointments Scheduled
Total Treatment Starts
Date of Last Referral
Whether you're preparing for a lunch meeting with a referring doctor or simply reviewing your referral network, these at-a-glance metrics help you quickly understand the strength and activity of each relationship.

Turn Data Into Better Relationships
Great reporting isn't about collecting more numbers. It's about making better decisions.
By showing how referrals move from introduction to treatment start, Bright Referral helps practices identify their strongest referral partners, recognize opportunities for deeper engagement, and invest time where it will have the greatest impact.
Because when you understand the health of your referral network, you can build stronger relationships, create better patient experiences, and grow your practice with confidence.

Comments